
Mining T-100: When Sheer Volume Meets Load Factor
In this post, we will explore the Air Carrier Statistics (T-100) dataset. Similar to DB1B, T-100 is collected and made available by the Bureau of Transportation Statistics (BTS). T-100 includes domestic non-stop segment data reported by both U.S. and foreign airline carriers and provides passenger volume and airline capacity information. The information provided by T-100 (i.e. carrier, origin, destination, aircraft type, available capacity, number of passengers, scheduled departures, departures performed, etc.), allows us to calculate the load factor of each flight.
By ranking all major U.S. airlines based on the ratio of total passenger carried to the total seats provided, a.k.a. the load factor, we can evaluate the performance of each carrier based on how efficient they are planning and utilizing their fleet. The plot below is the ranking of major U.S. airlines based on total passenger carried in 2017.
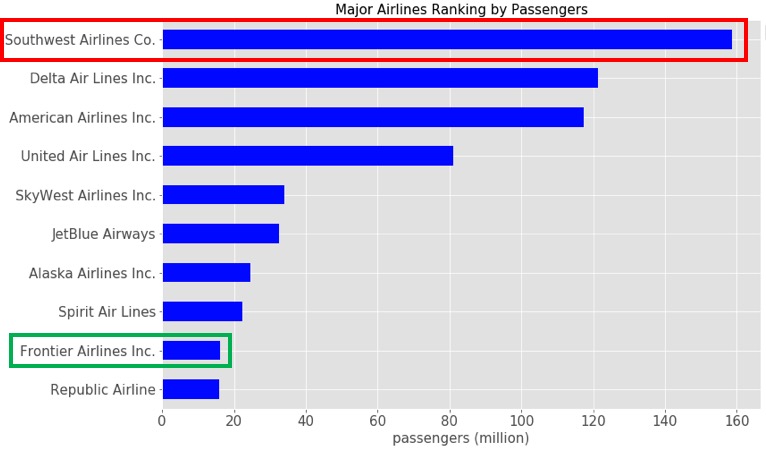
Figure 1: The rank of major airlines by passenger count from T-100 data (2017).
According to this figure, Southwest Airlines led the total number of passenger carried in 2017 by a huge margin when compared to other smaller low-cost carriers, such as Frontier Airlines. However, when comparing these two airlines based on the load factor (figure below), the situation changed dramatically. Now, Frontier Airlines ranked the 1st and Southwest drops to the 10th place.
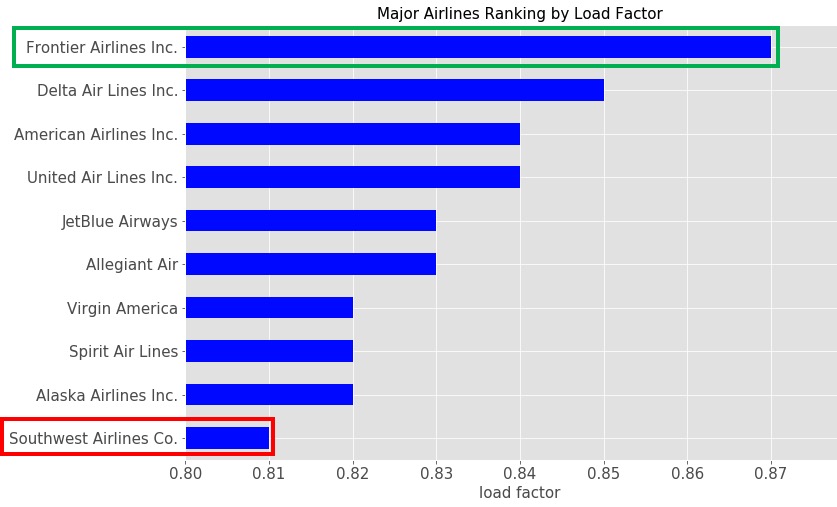
Figure 2: The rank of major airlines by load factor from T-100 data (2017).
The load factor ranking conveys a message that might indicate Frontier Airline is better capable of planning and utilizing its available resources compared to Southwest Airlines. Although a formal conclusion for this scenario requires further investigation, we can still get a sneak peek at the performance and possible business strategies of various airlines by exploring the T-100 dataset.